EMI Chart Preparation for Home, Car & Personal Loan
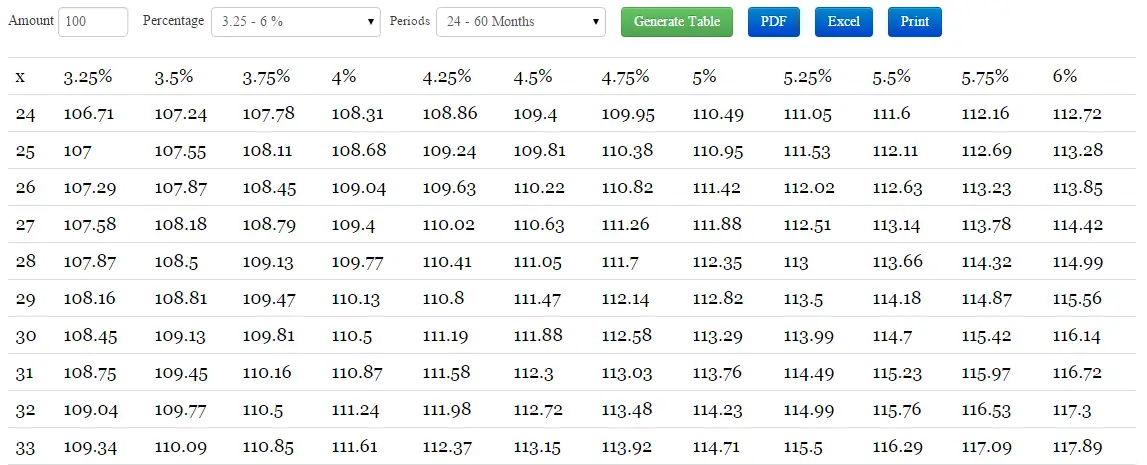
It's a quick reference loan repayment EMI chart preparation tool to find a suitable monthly repayment for all personal, car (auto), educational and home loan obtainable in pdf, excel, printable and downloadable format. EMI chart is a table of monthly payment quick reference sheet for a range of interest rates and time periods for a certain loan amount. It is an improvised version and alternative to general EMI calculator to determine an affordable monthly payment to repay personal or car or home loan. The main purpose of this chart is to provide a quick reference for loan lenders or borrowers to figure out the variations on monthly payments based on the time period and interest rate variations for a certain loan amount
| x | 6.25% | 6.5% | 6.75% | 7% | 7.25% | 7.5% | 7.75% | 8% | 8.25% | 8.5% | 8.75% | 9% |
| 5 Years | 1944.93 | 1956.61 | 1968.35 | 1980.12 | 1991.94 | 2003.79 | 2015.7 | 2027.64 | 2039.63 | 2051.65 | 2063.72 | 2075.84 |
| 5Y 1M | 1917.76 | 1929.46 | 1941.21 | 1953 | 1964.83 | 1976.71 | 1988.63 | 2000.59 | 2012.6 | 2024.65 | 2036.74 | 2048.87 |
| 5Y 2M | 1891.47 | 1903.19 | 1914.95 | 1926.76 | 1938.61 | 1950.51 | 1962.45 | 1974.43 | 1986.46 | 1998.53 | 2010.64 | 2022.8 |
| 5Y 3M | 1866.03 | 1877.76 | 1889.54 | 1901.37 | 1913.24 | 1925.15 | 1937.11 | 1949.11 | 1961.15 | 1973.25 | 1985.38 | 1997.56 |
| 5Y 4M | 1841.39 | 1853.14 | 1864.93 | 1876.77 | 1888.66 | 1900.59 | 1912.57 | 1924.59 | 1936.66 | 1948.77 | 1960.93 | 1973.13 |
| 5Y 5M | 1817.51 | 1829.28 | 1841.09 | 1852.95 | 1864.85 | 1876.8 | 1888.8 | 1900.84 | 1912.92 | 1925.06 | 1937.24 | 1949.46 |
| 5Y 6M | 1794.36 | 1806.14 | 1817.97 | 1829.85 | 1841.77 | 1853.74 | 1865.75 | 1877.82 | 1889.92 | 1902.08 | 1914.28 | 1926.52 |
| 5Y 7M | 1771.91 | 1783.71 | 1795.56 | 1807.45 | 1819.39 | 1831.38 | 1843.41 | 1855.49 | 1867.62 | 1879.8 | 1892.02 | 1904.29 |
| 5Y 8M | 1750.13 | 1761.94 | 1773.81 | 1785.72 | 1797.67 | 1809.68 | 1821.73 | 1833.83 | 1845.98 | 1858.18 | 1870.42 | 1882.72 |
| 5Y 9M | 1728.99 | 1740.82 | 1752.69 | 1764.62 | 1776.6 | 1788.62 | 1800.69 | 1812.82 | 1824.99 | 1837.2 | 1849.47 | 1861.78 |
| 5Y 10M | 1708.45 | 1720.3 | 1732.19 | 1744.14 | 1756.13 | 1768.17 | 1780.27 | 1792.41 | 1804.6 | 1816.84 | 1829.13 | 1841.46 |
| 5Y 11M | 1688.5 | 1700.37 | 1712.28 | 1724.24 | 1736.25 | 1748.31 | 1760.42 | 1772.59 | 1784.8 | 1797.06 | 1809.37 | 1821.73 |
| 6 Years | 1669.12 | 1680.99 | 1692.92 | 1704.9 | 1716.93 | 1729.01 | 1741.14 | 1753.32 | 1765.56 | 1777.84 | 1790.17 | 1802.55 |
| 6Y 1M | 1650.26 | 1662.16 | 1674.1 | 1686.1 | 1698.15 | 1710.25 | 1722.4 | 1734.6 | 1746.85 | 1759.16 | 1771.51 | 1783.92 |
| 6Y 2M | 1631.93 | 1643.84 | 1655.8 | 1667.81 | 1679.88 | 1692 | 1704.17 | 1716.39 | 1728.67 | 1740.99 | 1753.37 | 1765.8 |
| 6Y 3M | 1614.09 | 1626.01 | 1637.99 | 1650.02 | 1662.11 | 1674.25 | 1686.44 | 1698.68 | 1710.97 | 1723.32 | 1735.72 | 1748.17 |
| 6Y 4M | 1596.72 | 1608.66 | 1620.66 | 1632.71 | 1644.81 | 1656.97 | 1669.18 | 1681.44 | 1693.76 | 1706.12 | 1718.55 | 1731.02 |
| 6Y 5M | 1579.81 | 1591.77 | 1603.78 | 1615.85 | 1627.97 | 1640.15 | 1652.38 | 1664.66 | 1677 | 1689.39 | 1701.83 | 1714.33 |
| 6Y 6M | 1563.34 | 1575.32 | 1587.35 | 1599.43 | 1611.57 | 1623.77 | 1636.01 | 1648.32 | 1660.68 | 1673.09 | 1685.55 | 1698.07 |
| 6Y 7M | 1547.3 | 1559.29 | 1571.33 | 1583.44 | 1595.59 | 1607.81 | 1620.08 | 1632.4 | 1644.78 | 1657.21 | 1669.7 | 1682.24 |
| 6Y 8M | 1531.65 | 1543.66 | 1555.73 | 1567.85 | 1580.02 | 1592.26 | 1604.54 | 1616.89 | 1629.29 | 1641.74 | 1654.25 | 1666.82 |
| 6Y 9M | 1516.41 | 1528.43 | 1540.51 | 1552.65 | 1564.84 | 1577.1 | 1589.4 | 1601.77 | 1614.19 | 1626.67 | 1639.2 | 1651.79 |
| 6Y 10M | 1501.53 | 1513.58 | 1525.67 | 1537.83 | 1550.04 | 1562.31 | 1574.64 | 1587.03 | 1599.47 | 1611.97 | 1624.52 | 1637.14 |
| 6Y 11M | 1487.03 | 1499.08 | 1511.2 | 1523.37 | 1535.61 | 1547.9 | 1560.24 | 1572.65 | 1585.11 | 1597.63 | 1610.21 | 1622.85 |
| 7 Years | 1472.87 | 1484.94 | 1497.08 | 1509.27 | 1521.52 | 1533.83 | 1546.2 | 1558.62 | 1571.11 | 1583.65 | 1596.25 | 1608.91 |
- EMI chart
- How it differ from other traditional EMI calculators?
- Who can use this EMI chart?
- How to Use this tool to prepare an EMI Chart?
- How to use this EMI chart?
- Amortization
- How can loan lenders make use of it?
- How can loan borrowers make use of it?
- How to download a copy of EMI chart in pdf?
- How to download a copy of EMI chart in Excel?
- How get a print out of this EMI chart?
According to the different financial positions, people always would prefer to go for the suitable or affordable monthly repayments by changing the different available interest rates and tenures. A traditional EMI calculator generally allows user to calculate monthly repayment for one set of principal, interest rate and time period, thus the result is a single monthly payment. Every time user has to adjust the components of monthly payment calculation. In contrast, this EMI chart provides the matrix of monthly payments for the range of different interest rates and time periods, so it can reduce the frequency of using it multiple times to find the right EMI for a certain amount of loan. This EMI chart for loan borrowers is to help the users to make the comparison very simple, in the way it is provided.
- Home loan buyers or lenders
- Auto or Car loan buyers or lenders
- Personal loan buyers or lenders
- Education loan buyers or lenders
- Any financial institution that offers loan based on EMI
To determine an affordable EMI or monthly payment for a certain amount of loan, follow the below steps to prepare an EMI chart based on the different percentage and time period ranges.
- Enter the Loan amount
- Select the percentage range
- Select the Time Period by date range
- Hit Generate table to get the EMI table generated
The main purpose of this chart is to provide a better user experience to perform the comparison between the monthly repayments to select an affordable EMI. In the generated table of monthly repayments, look for suitable or affordable EMI and note down the percentage rate which is provided in the first row and time period in number of months provided in the first column of this chart.
To add more insight to the desired monthly payment calculation, the amortization calculator is integrated with in the EMI chart. The generated EMI chart contains a matrix of monthly payments to select from. Hit on a desired monthly payment redirect the user to the respective amortization chart for more insight for the monthly repayment selected; where user may find detailed amortization chart or more information of how much principal and interest amount each EMI or monthly payment consist of to repay the loan.
Any home loan or car loan or personal loan lenders or the financial institutions like citi bank, hdfc bank, sbi, Indian bank, Indian overseas bank etc may use this tool and prepare the EMI chart to explain to the borrowers about the variations on the monthly payment based on the different set of interest rates and time periods.
Any home loan or car loan or personal loan borrowers can pre calculate the suitable or affordable monthly payment based on their financial positions by referring the matrix of monthly payments based on the variations of interest rates and time periods.
This EMI chart is available in downloadable format. Users can download this EMI chart alone except other content of this page in the following way.
- Follow the above 4 steps given for How to Use this tool to prepare an EMI Chart?
- Click on the pdf button provided on the top left side corner of this page to get the EMI chart alone in pdf format
This EMI chart is also available in Excel format. Due to technical reasons, this excel format EMI chart only available for default values only. This format alone will not support user supplied values.
- Click on the Excel button provided on the top left side corner of this page to get the EMI chart in Excel format
This EMI chart is also available in printable format. The print can be taken in many ways but using the above print button provided on the top left side corner of this page only print the EMI chart alone.
- Follow the above 4 steps given for How to Use this tool to prepare an EMI Chart?
- Click on the Print button to get the EMI chart alone